Email Campaign Visualization Dashboard
Modified on: Fri, 24 Oct, 2025 at 6:18 PM
This article covers a powerful feature for those using Email Campaigns, the Email Campaign Visualization Dashboard. With this feature, you can access clear visualizations of email campaign activity, including delivery rates, open rates, and click rates. With drill-down metrics and exportable reports, these insights empower you to optimize your outreach strategies, refine messaging, and make data-driven decisions to improve campaign performance.
- Improve Engagement: Gain detailed insights into your email campaign performance to better connect with your audience.
- Increase Transparency: Build trust and confidence with a clear view of campaign activity metrics.
- Save Time: Effortlessly access and export reports to analyze performance at both high-level and granular levels.
TABLE OF CONTENTS |
 | Did you know? - You can click on the images in our articles to zoom in! |
Accessing Email Campaigns Dashboard
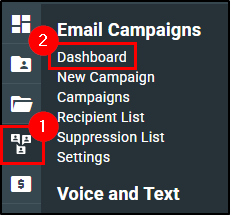
1. To access the Email Campaigns Visualization Dashboard, hover over the Communication Center icon (text bubble).
2. Under the Email Campaigns section, choose Dashboard. This will take you to the Campaign Overview page.
 |  |
Campaign Activity at a Glance
The Campaign Overview Page serves as your central dashboard for tracking email campaign performance.
Updated nightly to ensure the latest insights, this page provides a comprehensive view of all campaign activities and the following key performance metrics:
- Open Rate: Gauge how engaging your subject lines are.
- Click Rate: Measure the effectiveness of email content.
- Bounce Rate: Identify delivery issues, categorized by causes like invalid addresses.
- Spam Complaint Rates: Monitor compliance and audience sentiment.
- Unsubscribe Rates: Measure the percentage of recipients who opted out of your email list.
- Most Clicked Links: Identify the links in your emails that received the most clicks
- Top Performing Subject Lines: Highlights the subject lines that generated the highest open rates
- Bounce Causes: Break down the reasons behind email bounces
- Sent Campaigns: See a high-level of all the campaigns that have gone out to your customers.
Filters for Data Customization
Filters ensure you can customize the data views to your needs. On the Email Campaigns Dashboard, we have the following filters:
- Campaign Name Filter: Search for campaigns by name to quickly locate specific results.
- Sender Filter: Filter campaigns based on the email sender, enabling targeted performance analysis.
- Date Range Filter: Select a specific date range to view campaign metrics within a defined period.
 | Please Note - The selected filters are retained when navigating to drill-down pages, but changes are not applied when returning from drill-down pages to the Campaign Overview page. |

Trend Insights
The Trend Insights chip on each metric card provides a visual representation of how the selected metric is performing over time, based on the date range chosen.

These trend insights adjust based on filters selected, providing you with a clear indication of how each metric is evolving over time. You can hover over the chip to get details on what the trend is looking at.
- Positive / Up: If a metric increases in a positive way.
- Positive / Down: If a metric decreases in a positive way.
- Negative / Up: If a metric increases in a negative way.
- Negative Down: If a metric decreases in a negative way.
- No Change: Shows no change in the metric’s value during the selected period.
- No Trend Date: Indicates no significant pattern (up or down) in the data for the selected time range.

Drill-Down
Each metric card has a drill-down page which can be accessed by clicking on the card. The drill-down page allows you a deeper analysis of the specific metric. Any filters applied on the overview page will carry over to the drill-down page. However, you can change the filters while on the drill-down page if needed.
Export Functionality
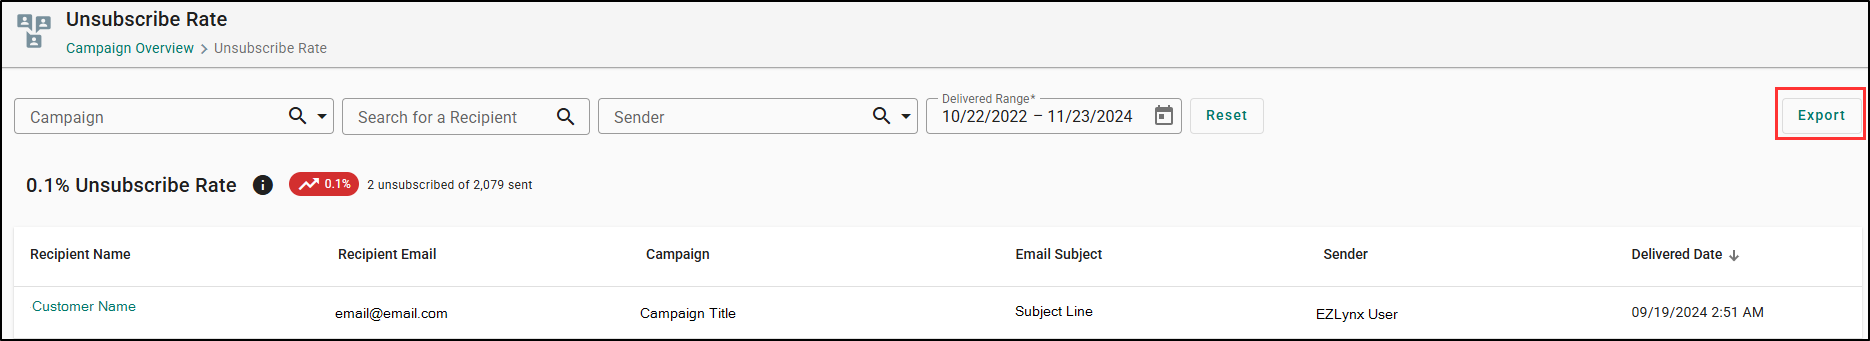
Each drill-down page (except for Most Clicked Links and Top Performing Subject Lines) includes an Export button which allows you to seamlessly export campaign activity data. This feature enables external analysis or record-keeping, providing detailed insights into campaign performance.
Performance Metric Cards
Now, let's cover each of the Email Campaign Visualization Metric Cards.
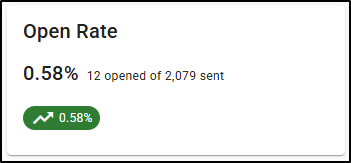
Open Rate
The open rate measures how many recipients opened your email out of the total emails successfully delivered. It indicates how effective your email subject lines are in capturing recipients’ attention.
Open Rate Trend Insights:
 | Positive / Up: If the open rate increases, the trend will show a positive change (upward). |
 | Negative / Down: If the open rate decreases, the trend will show a negative change (downward). |
 |
 |
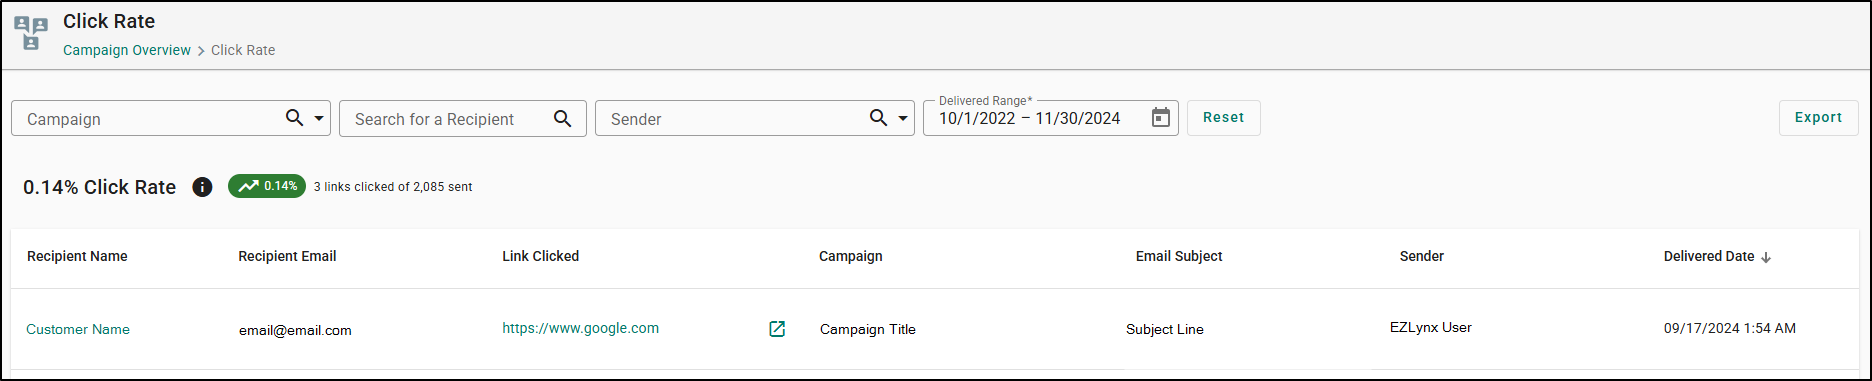
Click Rate
The click rate measures the percentage of recipients who clicked on a link or button within your email. This reflects the level of engagement and interest your audience has in the email content.
Click Rate Trend Insights:
 | Positive / Up: If the click rate goes up, the trend will show a positive change (upward). |
 | Negative / Down: If the click rate goes down, the trend will show a negative change (downward). |
 |
 |
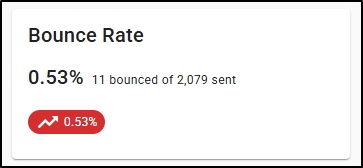
Bounce Rate
The bounce rate measures the percentage of emails that were not successfully delivered. Bounces can occur due to temporary issues (soft bounces) or permanent issues (hard bounces), such as invalid email addresses.
Bounce Rate Trend Insights:
 | Negative / Up: If the bounce rate increases, the trend will show a negative change (upward), as a higher bounce rate indicates a worse outcome. |
 | Positive / Down: If the bounce rate decreases, the trend will show a positive change (downward), indicating better performance. |
 |
 |
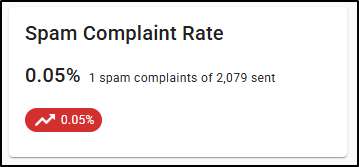
Spam Complaint Rate
The spam complaint rate measures the percentage of recipients who reported your email as spam. A high spam complaint rate could signal issues with your email relevance or frequency.
Spam Complaint Rate Trend Insights:
 | Negative / Up: If the spam complaint rate increases, the trend will show a negative change (upward), as higher complaints are undesirable. |
 | Positive / Down: If the spam complaint rate decreases, the trend will show a positive change (downward), indicating better email quality. |
 |
 |
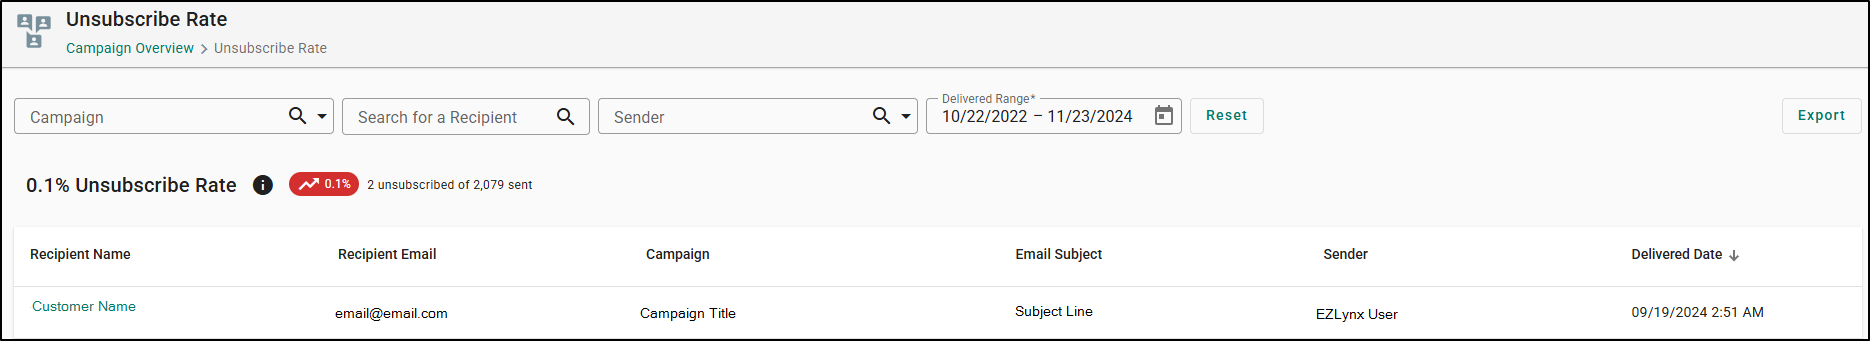
Unsubscribe Rate
The unsubscribe rate measures the percentage of recipients who opted out of your email list. A high unsubscribe rate could suggest your content isn’t resonating or is being sent too frequently.
Unsubscribe Rate Trend Insights:
 | Negative / Up: If the unsubscribe rate goes up, the trend will show a negative change (upward), signaling a higher number of unsubscribes, which is unfavorable. |
 | Positive / Down: If the unsubscribe rate goes down, the trend will show a positive change (downward), indicating improved engagement. |
 |
 |
Top Performing Subject Lines
This metric highlights the subject lines that generated the highest open rates. It helps identify which types of subject lines are most effective in capturing your audience’s attention.
On the metric card you will see the top 5 subject lines. In the drill-down page, you will see only the top 20 subject lines. Also subject lines with 0% open rates will not be displayed on the Top Performing Subject Lines lists.
If you click on the number in the Associated Campaigns column, a drawer panel will open displaying Campaign Titles that have used that subject line and their respective Open Rate percentage.
 |
|

| Please Note - There is no Export functionality for the Top Performing Subject Lines drill-down page. |
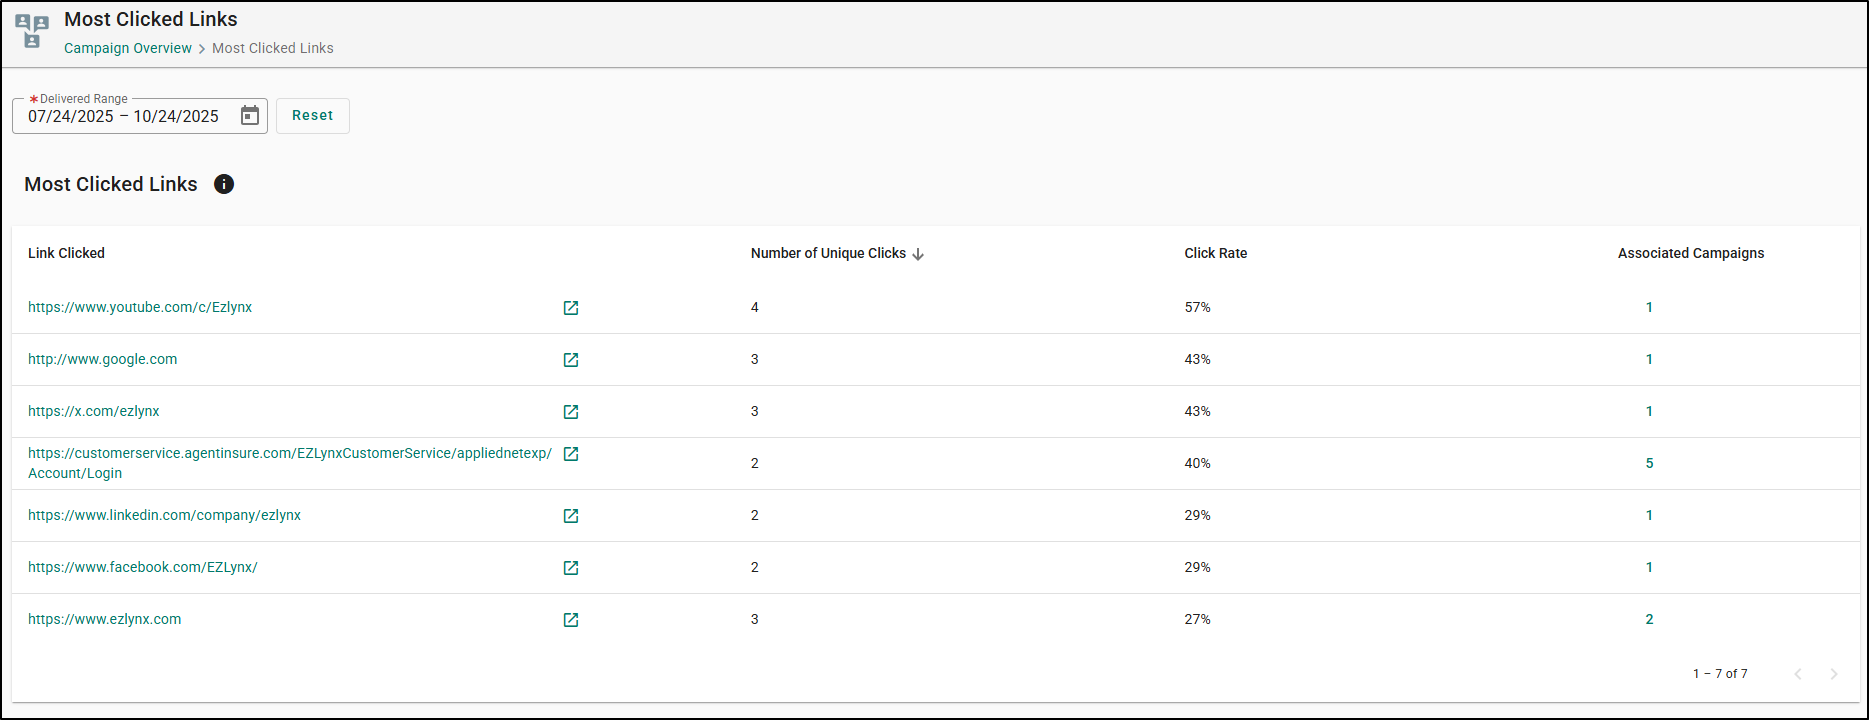
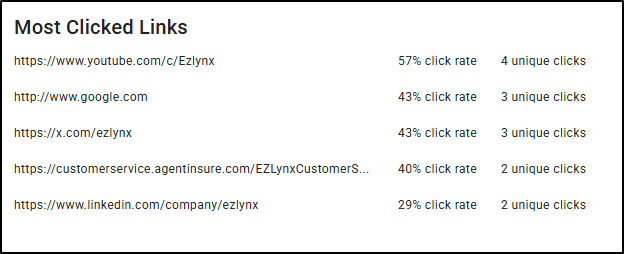
Most Clicked Links
This metric identifies the links in your emails that received the most clicks. These insights show which content or calls to action were most compelling to your audience.
On the metric card you will see the top 5 links. In the drill-down page, you will see only the top 20 links. If you click on the number in the Associated Campaigns column, a drawer panel will open displaying Campaign Titles that have used that link and their respective Click Rate percentage.
 |
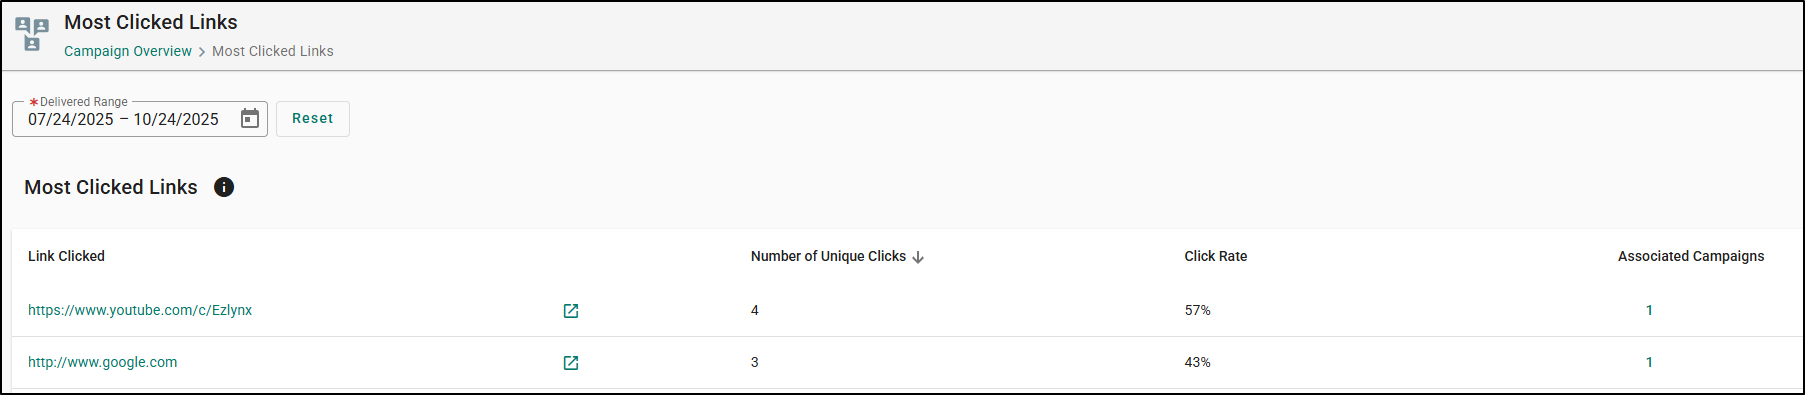 |
| Please Note - There is no Export functionality for the Most Clicked Links drill-down page. |
Bounce Causes
This metric breaks down the reasons behind email bounces, categorizing them into soft bounces (e.g., recipient’s inbox is full) and hard bounces (e.g., invalid email address). Understanding these causes can help improve deliverability.
The Bounce Causes could be labeled as the following:
- Content
- Frequency or Volume Too High
- Invalid Address
- Mailbox Unavailable
- Reputation
- Technical Failure
- Unclassified
- Unknown
If you click on the number in the Number of Bounced Emails column, a drawer panel will open displaying Recipient Names, their email addresses and the Assigned Producer for that client.
 |
 |
We hope this tour article was helpful in learning how to navigate the Email Campaigns Visualization Dashboard. Please let us know if this article was helpful by answering the question below. Check out our related articles on the right-side of the page to learn more about EZLynx!
Did you find it helpful? Yes No
Send feedback