Reports 5.0 Limited Beta - Aged Receivable Report
Modified on: Fri, 29 Sep, 2023 at 1:23 PM
We're excited to announce that Reports 5.0 Beta in Looker is now available in limited release for select Beta Accounting Users! We are not currently taking anymore applications for this Beta at this time, but be on the lookout for future releases for the beta expansion. Our Reports 5.0 features new and improved capabilities for data visualization and reporting. Significant performance improvements also ensure faster report generations times. Streamlined drill through capabilities and increased columns of data allow for more efficient and in-depth analysis. Additionally, you can generate beautiful, professional-looking reports with improved PDF and CSV reports. These updates will help you generate more insightful reports, enabling better business decisions.
In this article, we will be covering the Aged Receivable Report which allows you to track your customers that have open balances. To learn more about Reports 5.0 Beta, check out our Reports 5.0 Limited Beta for Accounting Reports article!
TABLE OF CONTENTS
- Accessing the Report
- Applying Filters
- Sorting and Moving Columns
- Drill Through Data
- Download and Schedule
- Favorites and Folders
 | Did you know? - You can click on the images in our articles to make them bigger! |
Accessing the Report
To access the Aged Receivable report, hover over the Reports icon and then click on the Accounting option under the Beta Categories section.

Then, click on the Aged Receivable card.

Applying Filters
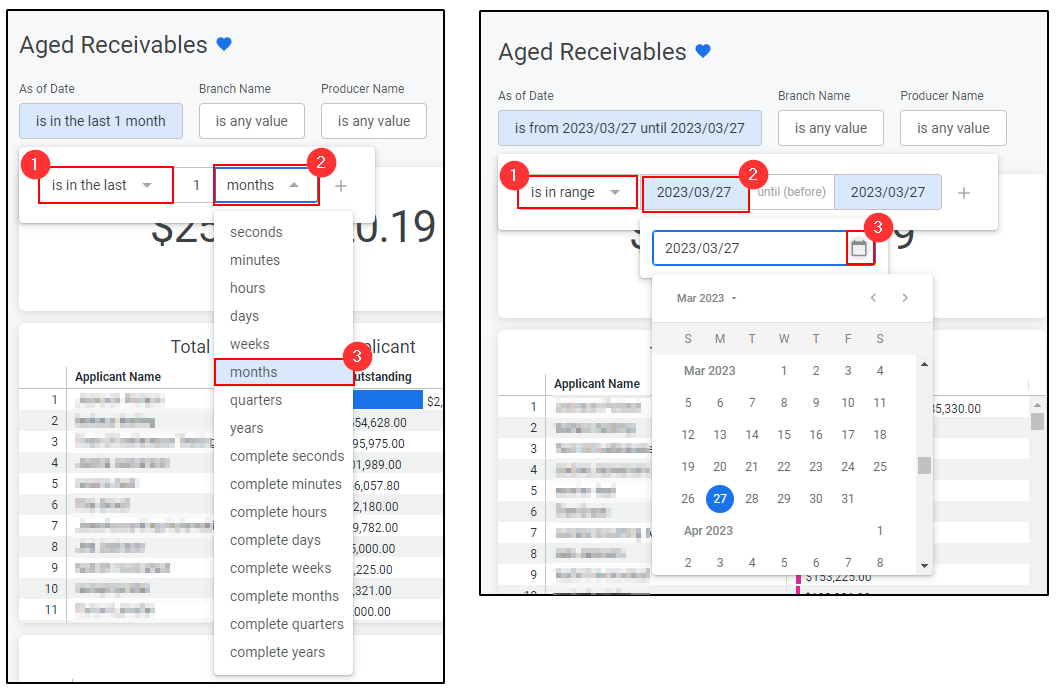
You can find the filters for a report underneath the name of the report. If you click on a filter you will be given a drop-down or a list of options. For example, clicking on the "is any time" underneath the As of Date filter, the system will provide you with a drop-down. If you click into the drop-down, it will show the list of different date filters you could apply to the report.

Depending on what date filter you click from the drop-down menu will determine next steps. For example, clicking on the "is in the last" provides you with a numerical field and a drop-down to select a specific time frame like months or days. While clicking on "is in range" provides two date fields where you can input two dates to create a range.
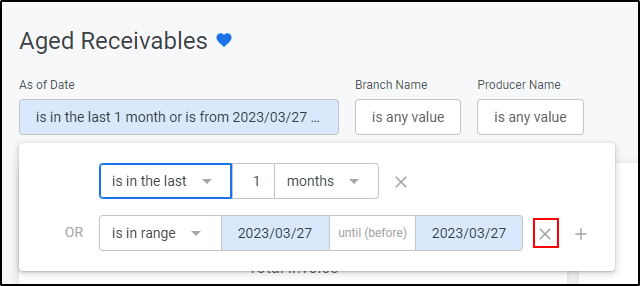
You can also add multiple of the same type of filter by clicking on the plus icon.

If you added an extra filter in error, simply click the 'X' next to the filter you want to remove.
Once you have applied the filters you would like to the report, click on the refresh icon in the top right-hand corner of the report.

If you ever want to hide the filters, you can click on the filter icon next to the refresh icon. This will hide the filters. If you ever want to show hidden filters, simply click the filter icon again.

Check out the table for the list of currently available filters and their functions!
| Filter Name | Filter Function |
|---|---|
| As of Date | Allows you to filter the report by date using the many different options available. |
| Branch Name | Allows you to filter the report by specific agency or agencies. |
| Producer Name | Allows you to filter the report by specific producer or producers. |
Sorting and Moving Columns
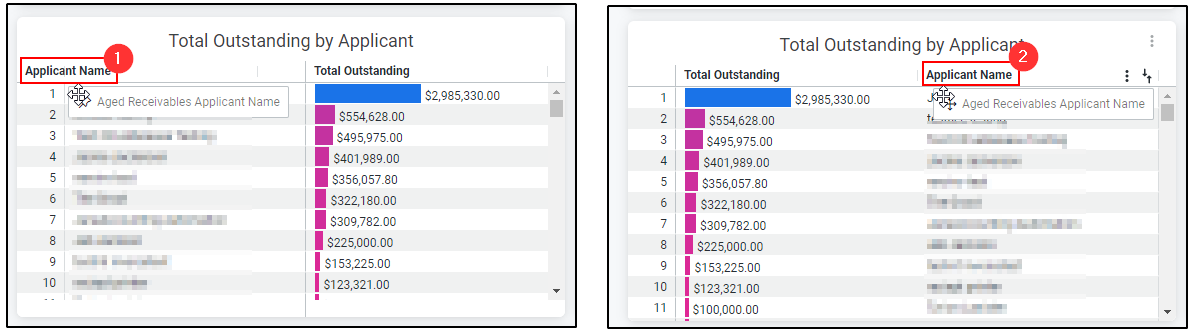
Sorting and moving columns is really simple with the new reports. To move a column so that it's in a different order, simply click and drag the column title to where in the report you want it to go.
Sorting columns is just as easy. Hover over the column you'd like to sort. This will cause two new buttons to appear. The first button is Column Options. The second button is Sort Columns. Click on the Sort Columns button and the system will automatically refresh to update the correct sort. Clicking on the Sort Columns button again will switch the sort direction.

Drill Through Data
We've added a new drill through feature to the reports, which allows you to access detailed information quickly and easily on individual invoices or bills. This feature streamlines the drill through process by accessing more detailed information with just a few clicks.
To drill through a particular piece of data, hover over the data. If a dotted line appears under the data, then it is a "drillable" piece of data. Simply click on the data to trigger the drill through feature.

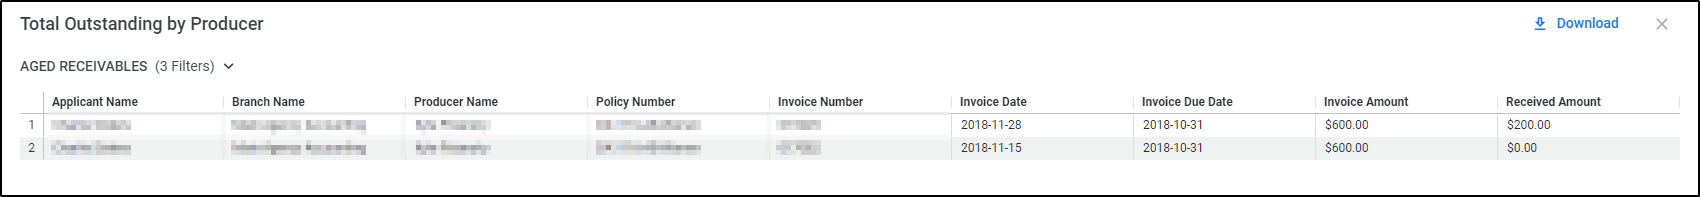
A pop-up will appear with a table that details the information that makes up the previous piece of data. You can download this data by clicking on the Download icon in the top right-hand corner of the pop-up. To go back to the main report, click on the 'X' in the top right-hand corner of the pop-up.
Download and Schedule
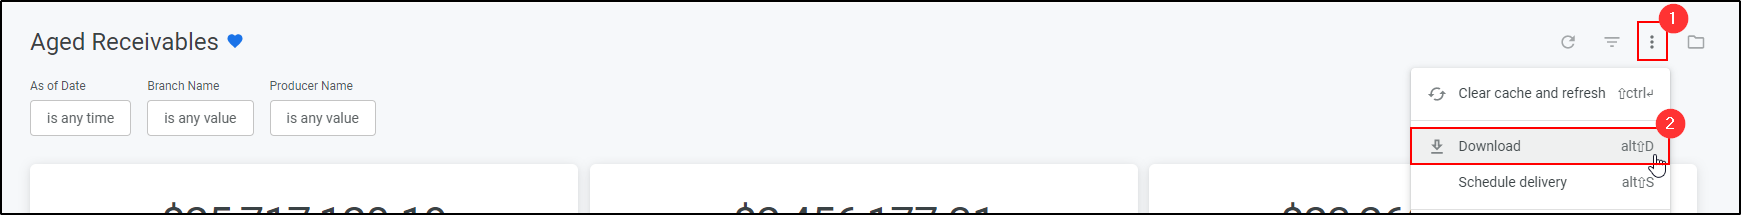
Once you have your report just the way you like it and want to show it off to others, you can download the report as either a PDF or a CSV. To download the report as a whole, click on the Dashboard Actions icon in the top right-hand corner of the report. Then, click Download.
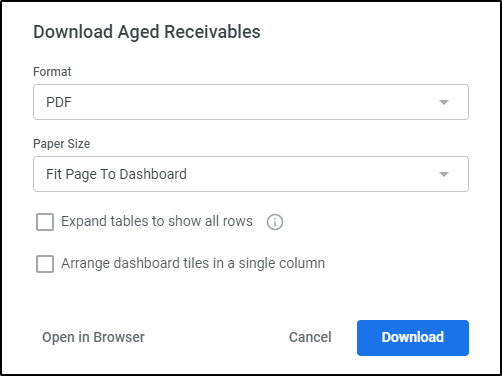
A pop-up will appear that allows you to choose how you want to download the report. Once you have decided, click the Download button.
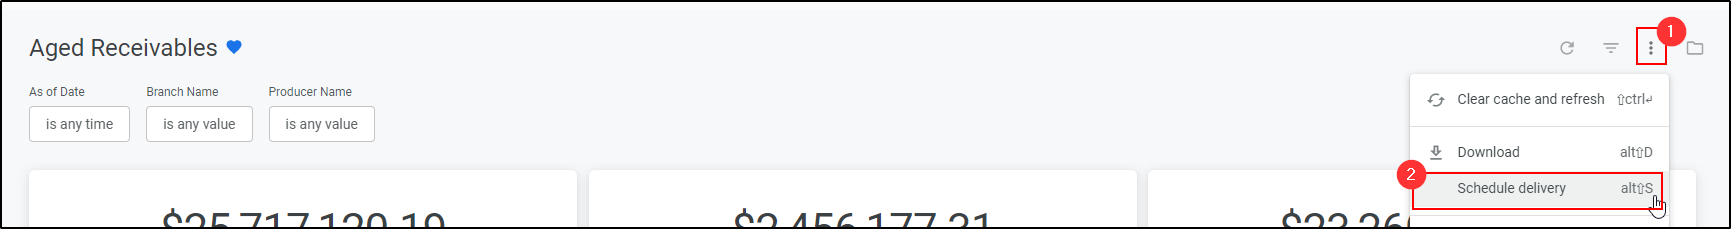
If you love this report so much that you want to get the data on a regular basis, you can choose to Schedule the report so it's sent to you on a chosen cadence. To schedule a report, click on the Dashboard Actions icon and click on Schedule Delivery.
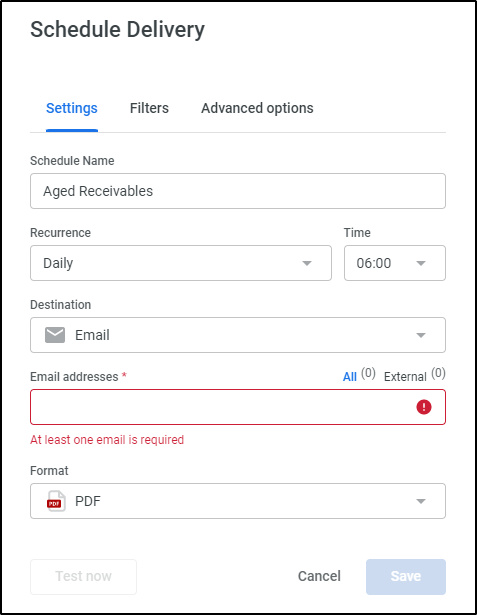
A pop-up will appear which will provide you with a multitude of options. Once you have the scheduled report just how you like it click the Save button.
Any reports you Save or Schedule can be found under the Saved Reports or Scheduled Reports respectively.

Favorites and Folders
Navigating between different reports has also gotten easier. You can now favorite reports by clicking on the heart next to the Reports name.

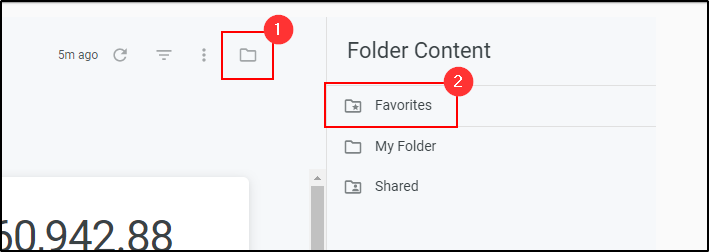
To navigate between your favorite reports, click on the Folders icon in the top right-hand corner of the report. This will open a pane on the right. Click on Favorites. This will provide you a list of all the reports you have favorited.
Did you find it helpful? Yes No
Send feedback