Email Campaign Activity Visualization
Modified on: Sat, 25 Oct, 2025 at 1:13 AM
This release introduces a powerful feature for EZLynx Email Campaigns: Campaign Activity Insights. With this update, agents can access clear visualizations of email campaign activity, including delivery rates, open rates, and click rates. These insights empower agents to optimize their outreach strategies, refine messaging, and make data-driven decisions to improve campaign performance.
- Agents can now view a dashboard with the following key metrics for all email campaigns:
- Total Sent Emails: Track the total volume of emails sent.
- Delivery Rate: Understand how many emails reached their recipients.
- Open Rate: Gauge how engaging your subject lines are.
- Click Rate: Measure the effectiveness of email content.
- Bounce Rate: Identify delivery issues, categorized by causes like invalid addresses.
- Spam and Unsubscribe Rates: Monitor compliance and audience sentiment.
- Drill-down metrics: Agents can dive deeper into specific metrics.
- Exportable Reports: Easily export detailed campaign reports for in-depth analysis. These reports provide recipient-level details.
We've also made a major enhancement to the Email Campaign widget on the Applicant Overview page, transforming how you track, manage, and gain insights into email campaign communications with your applicants!
This update addresses critical needs, ensuring complete communication records for email sent as email campaigns and communications triggered via Automation Center, providing valuable campaign performance metrics, and streamlining your workflow directly from the applicant's profile.
 | Did you know? - You can make our images bigger by clicking on them. |
Overview Page – Campaign Activity at a Glance
The Campaign Overview Page serves as your central dashboard for tracking email campaign performance.
Updated nightly to ensure the latest insights, this page provides a comprehensive view of all campaign activities and key performance metrics.
Filters for Data Customization
- Campaign Name Filter: Search for campaigns by name to quickly locate specific results.
- Sender Filter: Filter campaigns based on the email sender, enabling targeted performance analysis.
- Date Range Filter: Select a specific date range to view campaign metrics within a defined period.
Filters ensure users can customize their data views efficiently.
Note: The selected filters are retained when navigating to drill-down pages, but changes are not applied when returning from drill-down pages to the overview page.

Performance Metric Cards
At the top of the page, several cards display key performance metrics:
Open Rate
The open rate measures how many recipients opened your email out of the total emails successfully delivered. It indicates how effective your email subject lines are in capturing recipients’ attention.
 |
Drill Down Page  |
Click Rate
The click rate measures the percentage of recipients who clicked on a link or button within your email. This reflects the level of engagement and interest your audience has in the email content.
 |
Drill Down Page  |
Bounce Rate
The bounce rate measures the percentage of emails that were not successfully delivered. Bounces can occur due to temporary issues (soft bounces) or permanent issues (hard bounces), such as invalid email addresses.
A white background with black text
 |
Drill Down Page  |
Spam Complaint Rate
The spam complaint rate measures the percentage of recipients who reported your email as spam. A high spam complaint rate could signal issues with your email relevance or frequency.
 |
Drill Down Page  |
Unsubscribe Rate
The unsubscribe rate measures the percentage of recipients who opted out of your email list. A high unsubscribe rate could suggest your content isn’t resonating or is being sent too frequently.
 |
Drill Down Page  |
Top Performing Subject Lines
This metric highlights the subject lines that generated the highest open rates. It helps identify which types of subject lines are most effective in capturing your audience’s attention.
 |
Drill Down Page
|

Most Clicked Links
This metric identifies the links in your emails that received the most clicks. These insights show which content or calls to action were most compelling to your audience.
 |
Drill Down Page 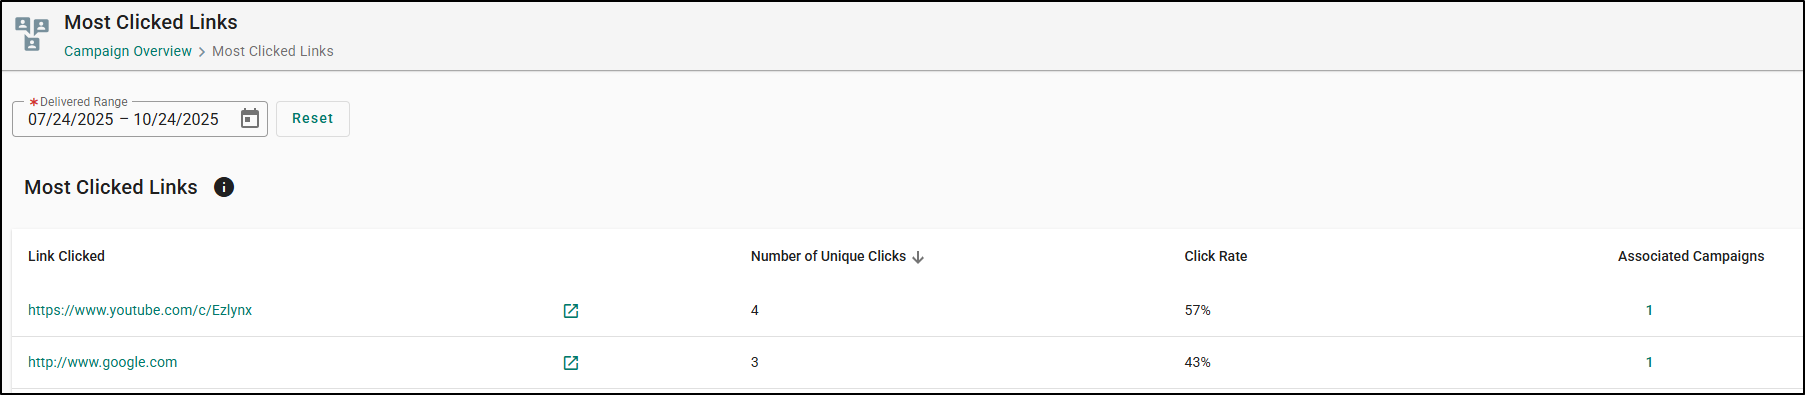 |
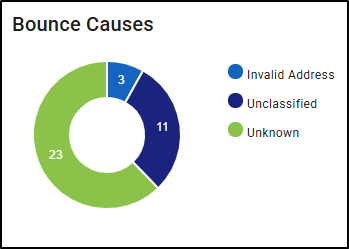
Bounce Causes
This metric breaks down the reasons behind email bounces, categorizing them into soft bounces (e.g., recipient’s inbox is full) and hard bounces (e.g., invalid email address). Understanding these causes can help improve deliverability.
- Content
- Frequency or Volume Too High
- Invalid Address
- Mailbox Unavailable
- Reputation
- Technical Failure
- Unclassified
- Unknown
 |
Drill Down Page  |
Export Functionality
Each drill-down page includes an Export option, allowing users to seamlessly export campaign activity data. This feature enables external analysis or record-keeping, providing detailed insights into campaign performance.

Trend Insights
The Trend Insights chip on each metric card provides a visual representation of how the selected metric is performing over time, based on the date range chosen.

- Open Rate:
- Positive/Up: If the open rate increases, the trend will show a positive change (upward).
- Negative/Down: If the open rate decreases, the trend will show a negative change (downward).
- Click Rate:
- Positive/Up: If the click rate goes up, the trend will show a positive change (upward).
- Negative/Down: If the click rate goes down, the trend will show a negative change (downward).
- Bounce Rate:
- Negative/Up: If the bounce rate increases, the trend will show a negative change (upward), as a higher bounce rate indicates a worse outcome.
- Positive/Down: If the bounce rate decreases, the trend will show a positive change (downward), indicating better performance.
- Spam Complaint Rate:
- Negative/Up: If the spam complaint rate increases, the trend will show a negative change (upward), as higher complaints are undesirable.
- Positive/Down: If the spam complaint rate decreases, the trend will show a positive change (downward), indicating better email quality.
- Unsubscribe Rate:
- Negative/Up: If the unsubscribe rate goes up, the trend will show a negative change (upward), signaling a higher number of unsubscribes, which is unfavorable.
- Positive/Down: If the unsubscribe rate goes down, the trend will show a positive change (downward), indicating improved engagement.
These trend insights adjust based on the filters selected, providing users with a clear indication of how each metric is evolving over time.
- No Trend Date: Indicates no significant pattern (up or down) in the data for the selected time range.
- No Change: Shows no change in the metric’s value during the selected period.

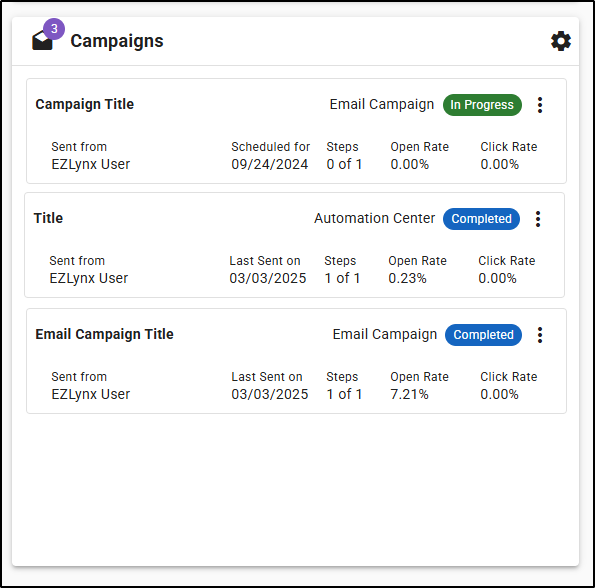
Applicant Overview Email Campaigns Widget
The revamped Email Campaigns Widget on Applicant Overview Page now clearly presents both in-progress campaigns (at the top) and completed campaigns. Each card provides:
- Campaign Name: With a wrapping name and persistent tooltip.
- Email Source: Email Campaigns or Automation Center
- Status: Whether the Campaign is In Progress or Completed
- Sent from: Displays the sender.
- "Scheduled for" (for upcoming steps) or "Last Sent on" (for sent steps), along with "Steps" count.
- Key Metrics: Open Rate and Click Rate specific to the currently viewed applicant.
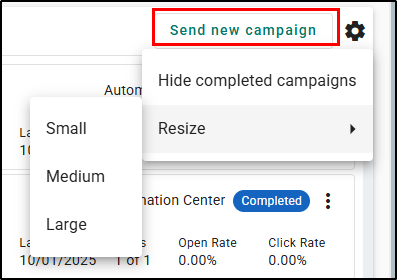
The widget now has the following actions under the gear icon:
- Hide Completed Campaigns: Toggle this option to focus only on active or scheduled campaigns.
- Resize: Use the resize options (Small, Medium, Large) to adjust the widget's display.

There is also a new prominent button Send New Campaign which allows you to quickly initiate a new campaign using a new side drawer panel.
Each campaign card now features an actions menu with options dependent on if the campaign is In Progress or Completed.
 | 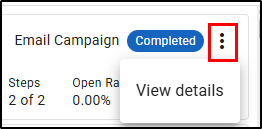 |
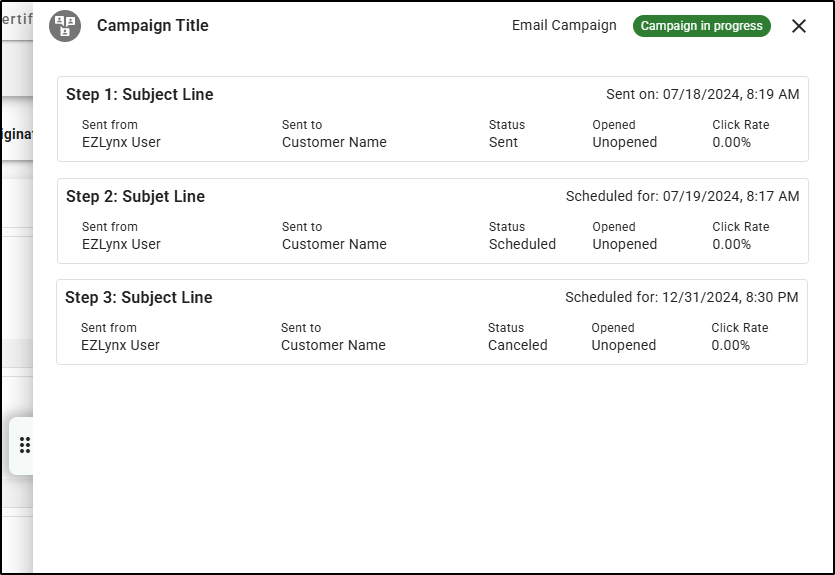
- View Details: Available during In Progress or Completed. Opens a side drawer panel providing a granular view of the campaign's progress for this applicant, including status (Unopened, Aborted, Date when opened) and click rates per step.
- Remove Campaign: Only available during In Progress campaigns. Clicking this action will bring up a confirmation to remove recipients from the campaign. It displays an Applicant Table with Name, Email, and Type. Simply check the box next to the recipients you'd like to remove and then choose Remove to finalize. You can choose Cancel to close the screen without removing anyone.

Why is this important?
This update revolutionizes the way you measure and improve their email campaigns. With transparent metrics and actionable insights, EZLynx Email Campaigns now empowers you to achieve greater engagement and better outcomes. These enhancements reflect our commitment to delivering tools that drive measurable success for our users.
- Improve Engagement: Gain detailed insights into your email campaign performance to better connect with your audience.
- Increase Transparency: Build trust and confidence with a clear view of campaign activity metrics.
- Save Time: Effortlessly access and export reports to analyze performance at both high-level and granular levels.
- Actionable Insights: Adjust campaigns based on real-time performance data to maximize results.
We hope you are excited for this upcoming feature and look forward to our future releases. Check out the articles on the right-side to learn more about EZLynx.
Did you find it helpful? Yes No
Send feedback